Drone shot of various tall trees in a park. The park is bordered by a lake or river.

Connecting eDNA with action

From data to insights

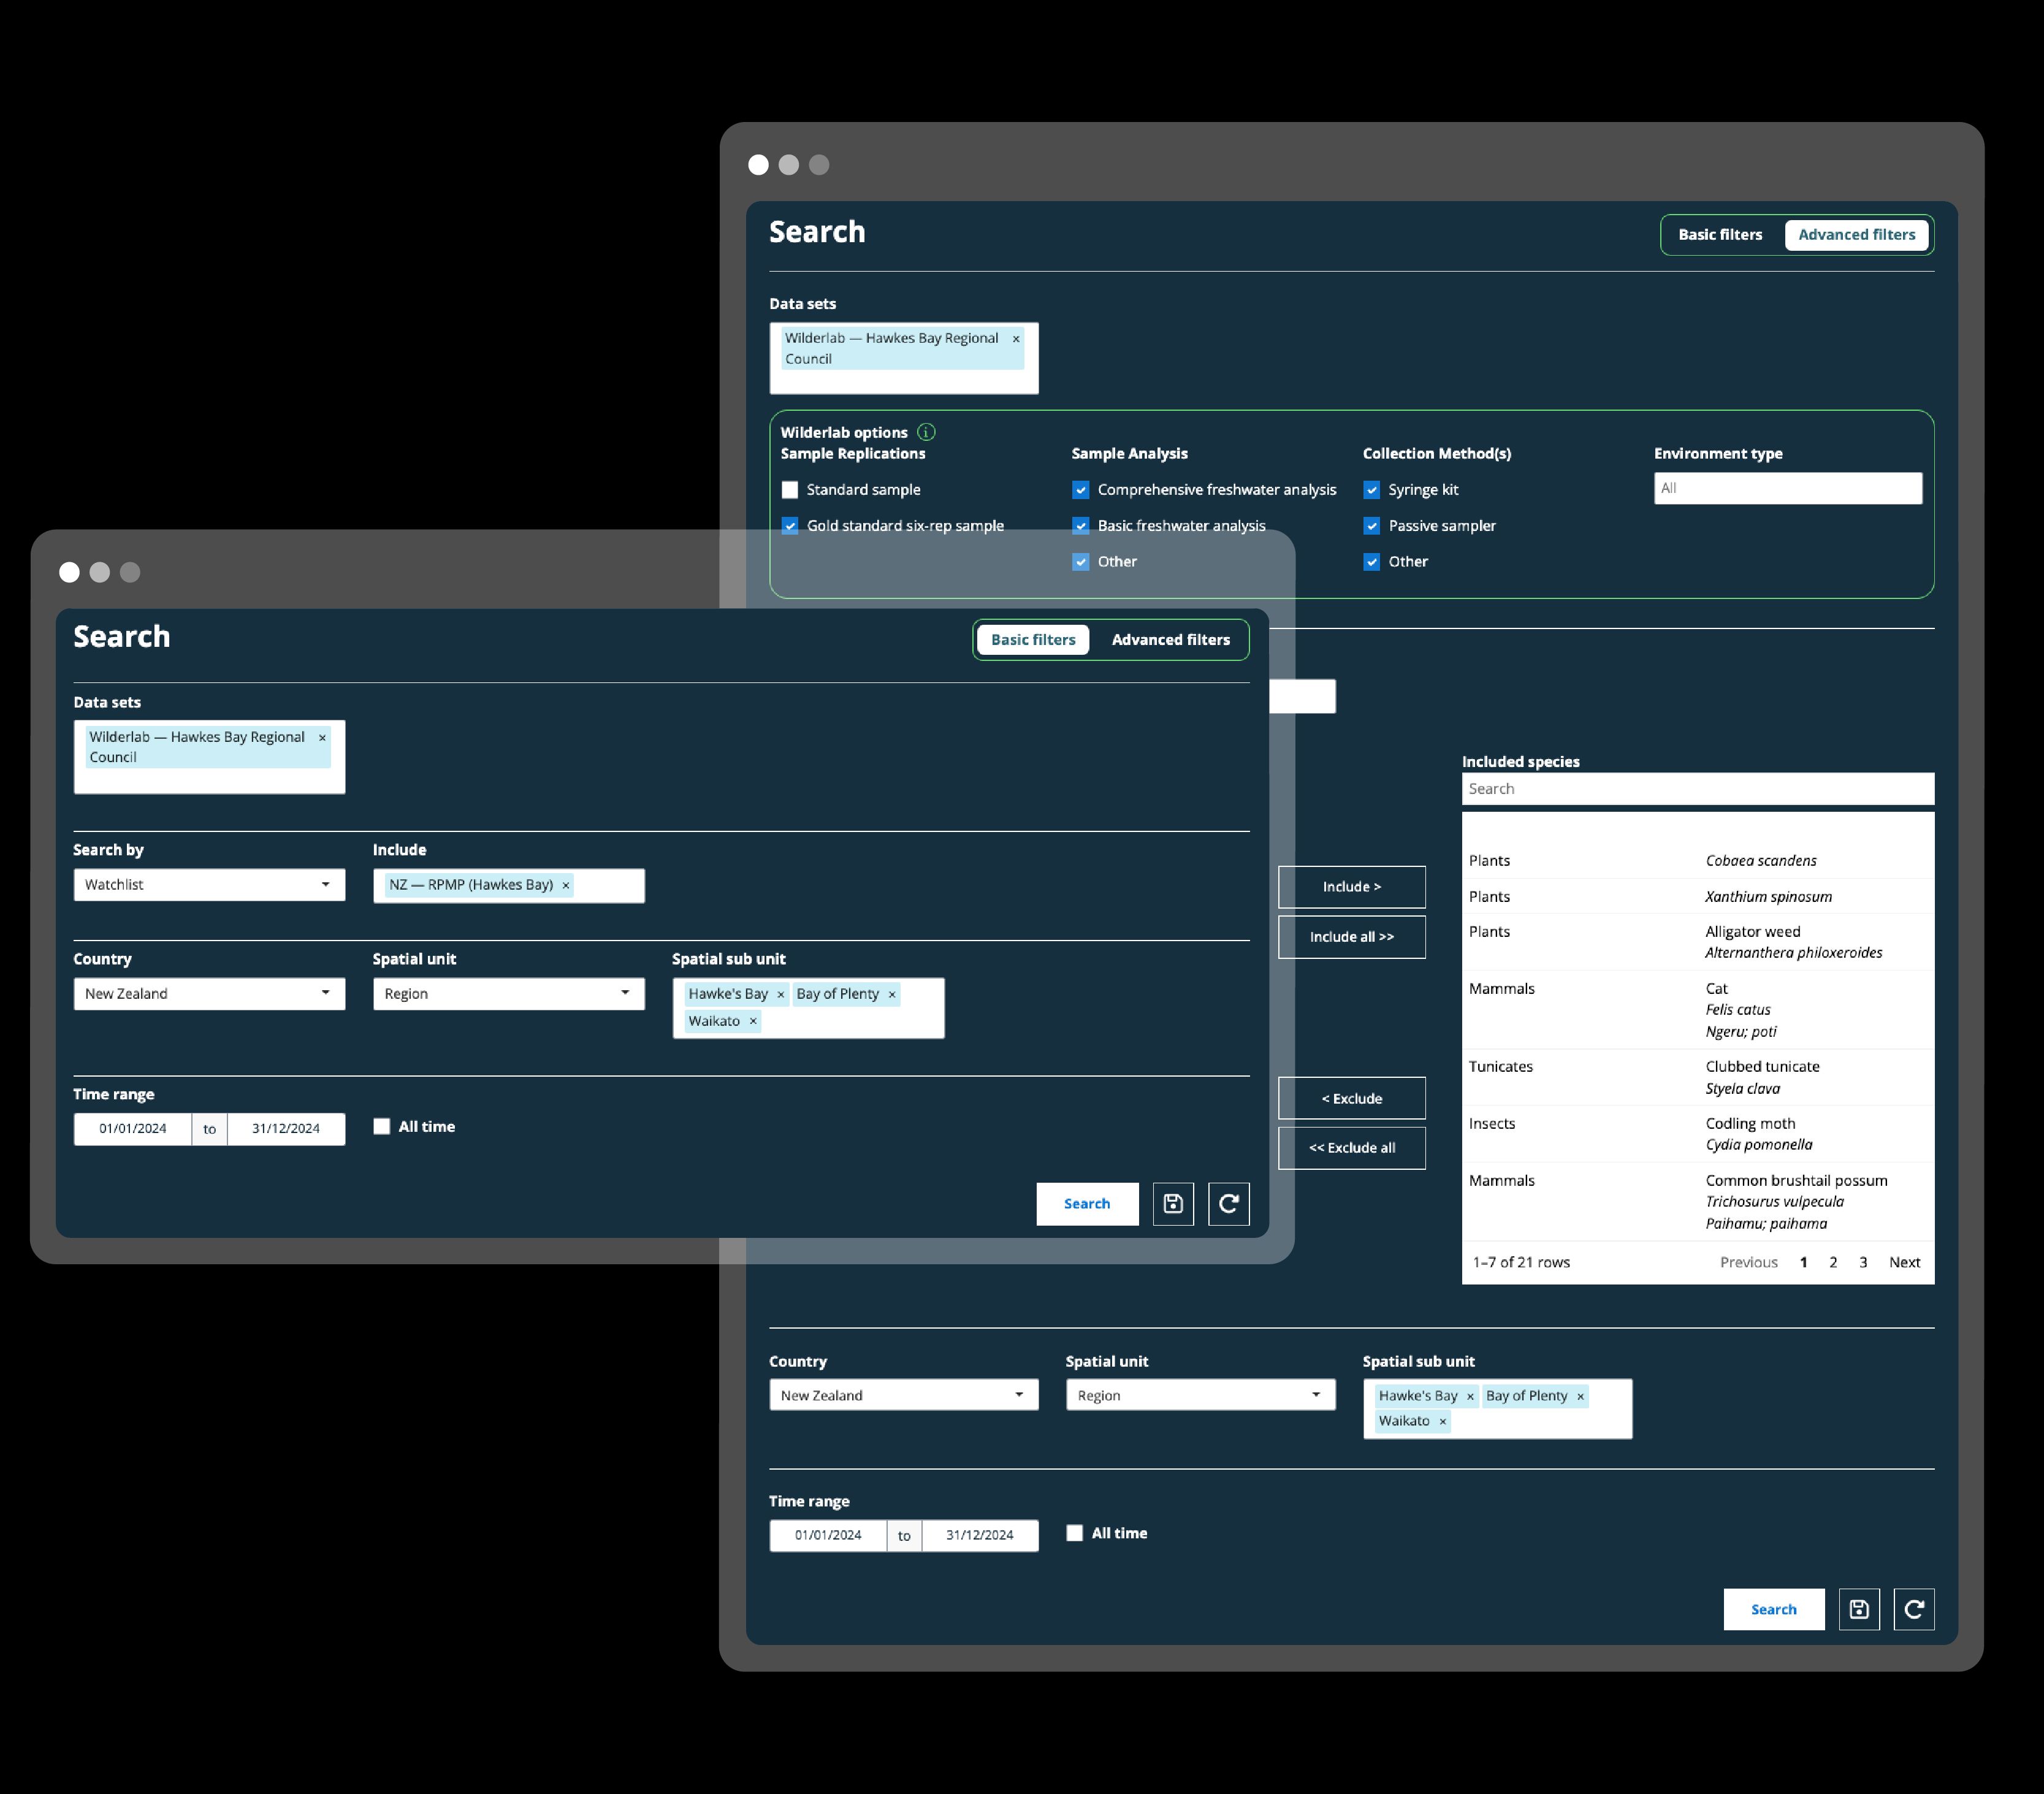
The Ripple search interface, which allows users to configure a large number of variables to filter eDNA data.

Highly customised searches

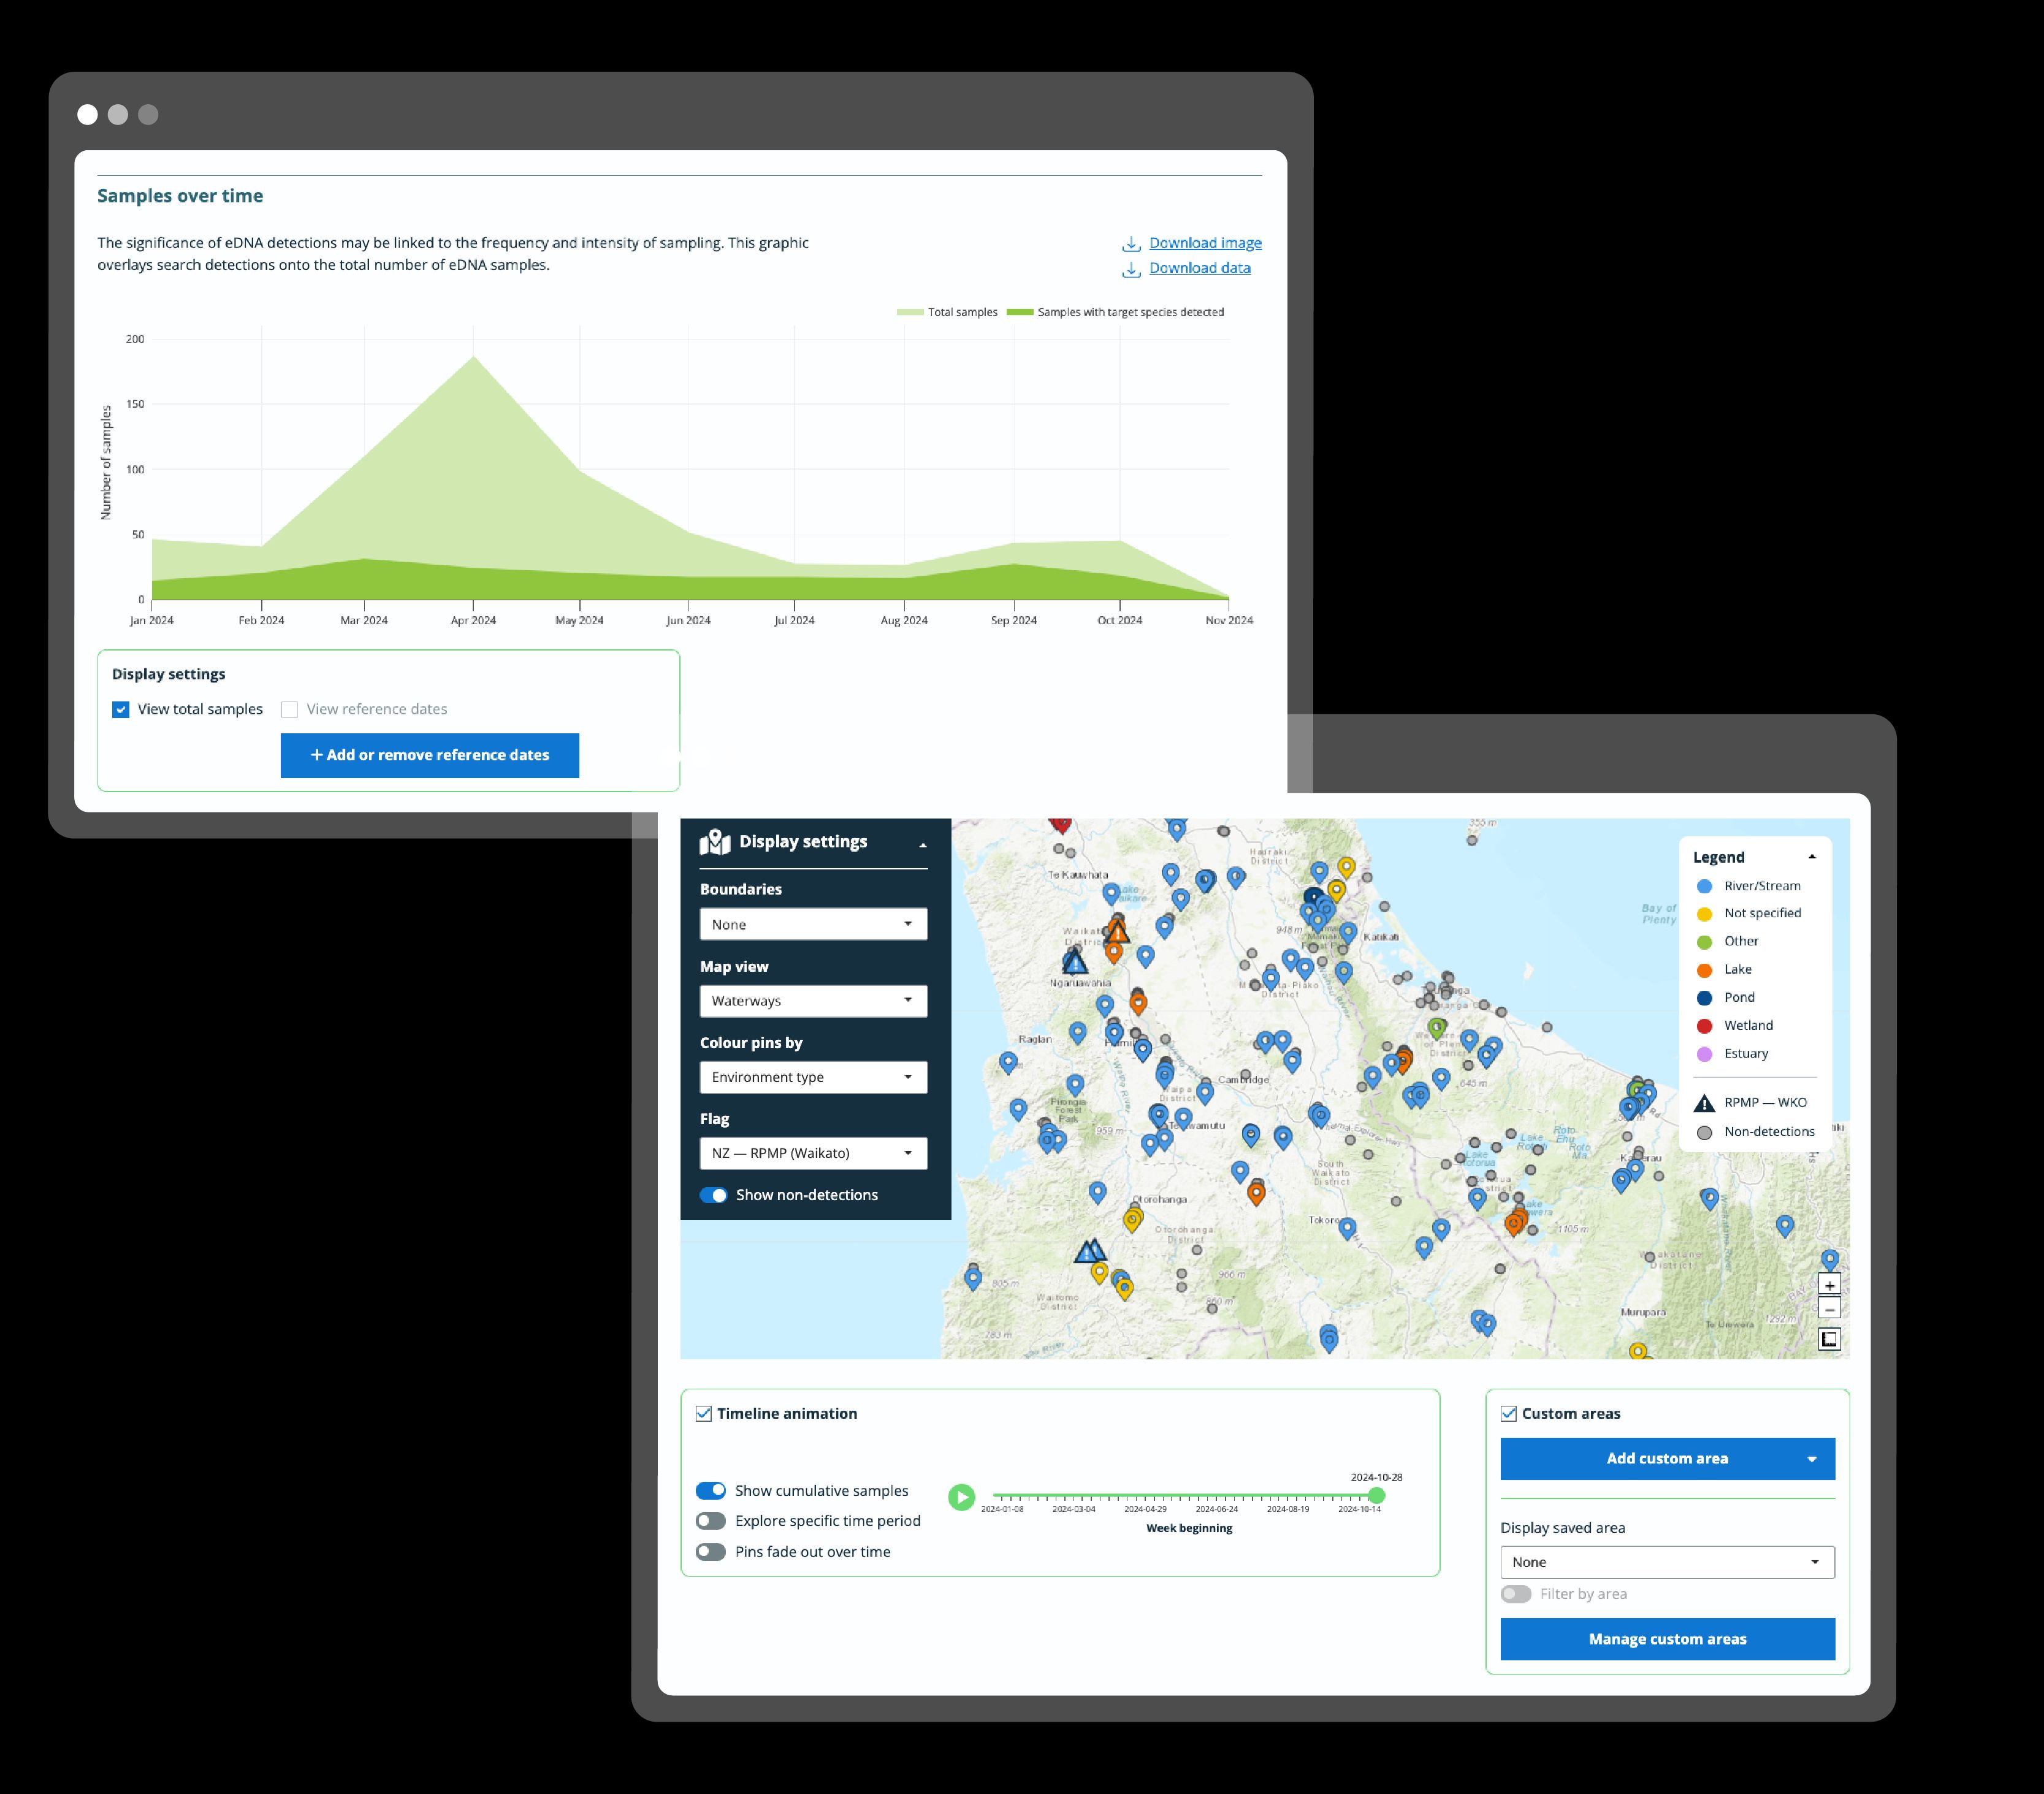
Two data visualisations that are generated automatically within Ripple. Specifically, showing sample locations on a map, and showing the sample detections over time.

Sophisticated visualisations

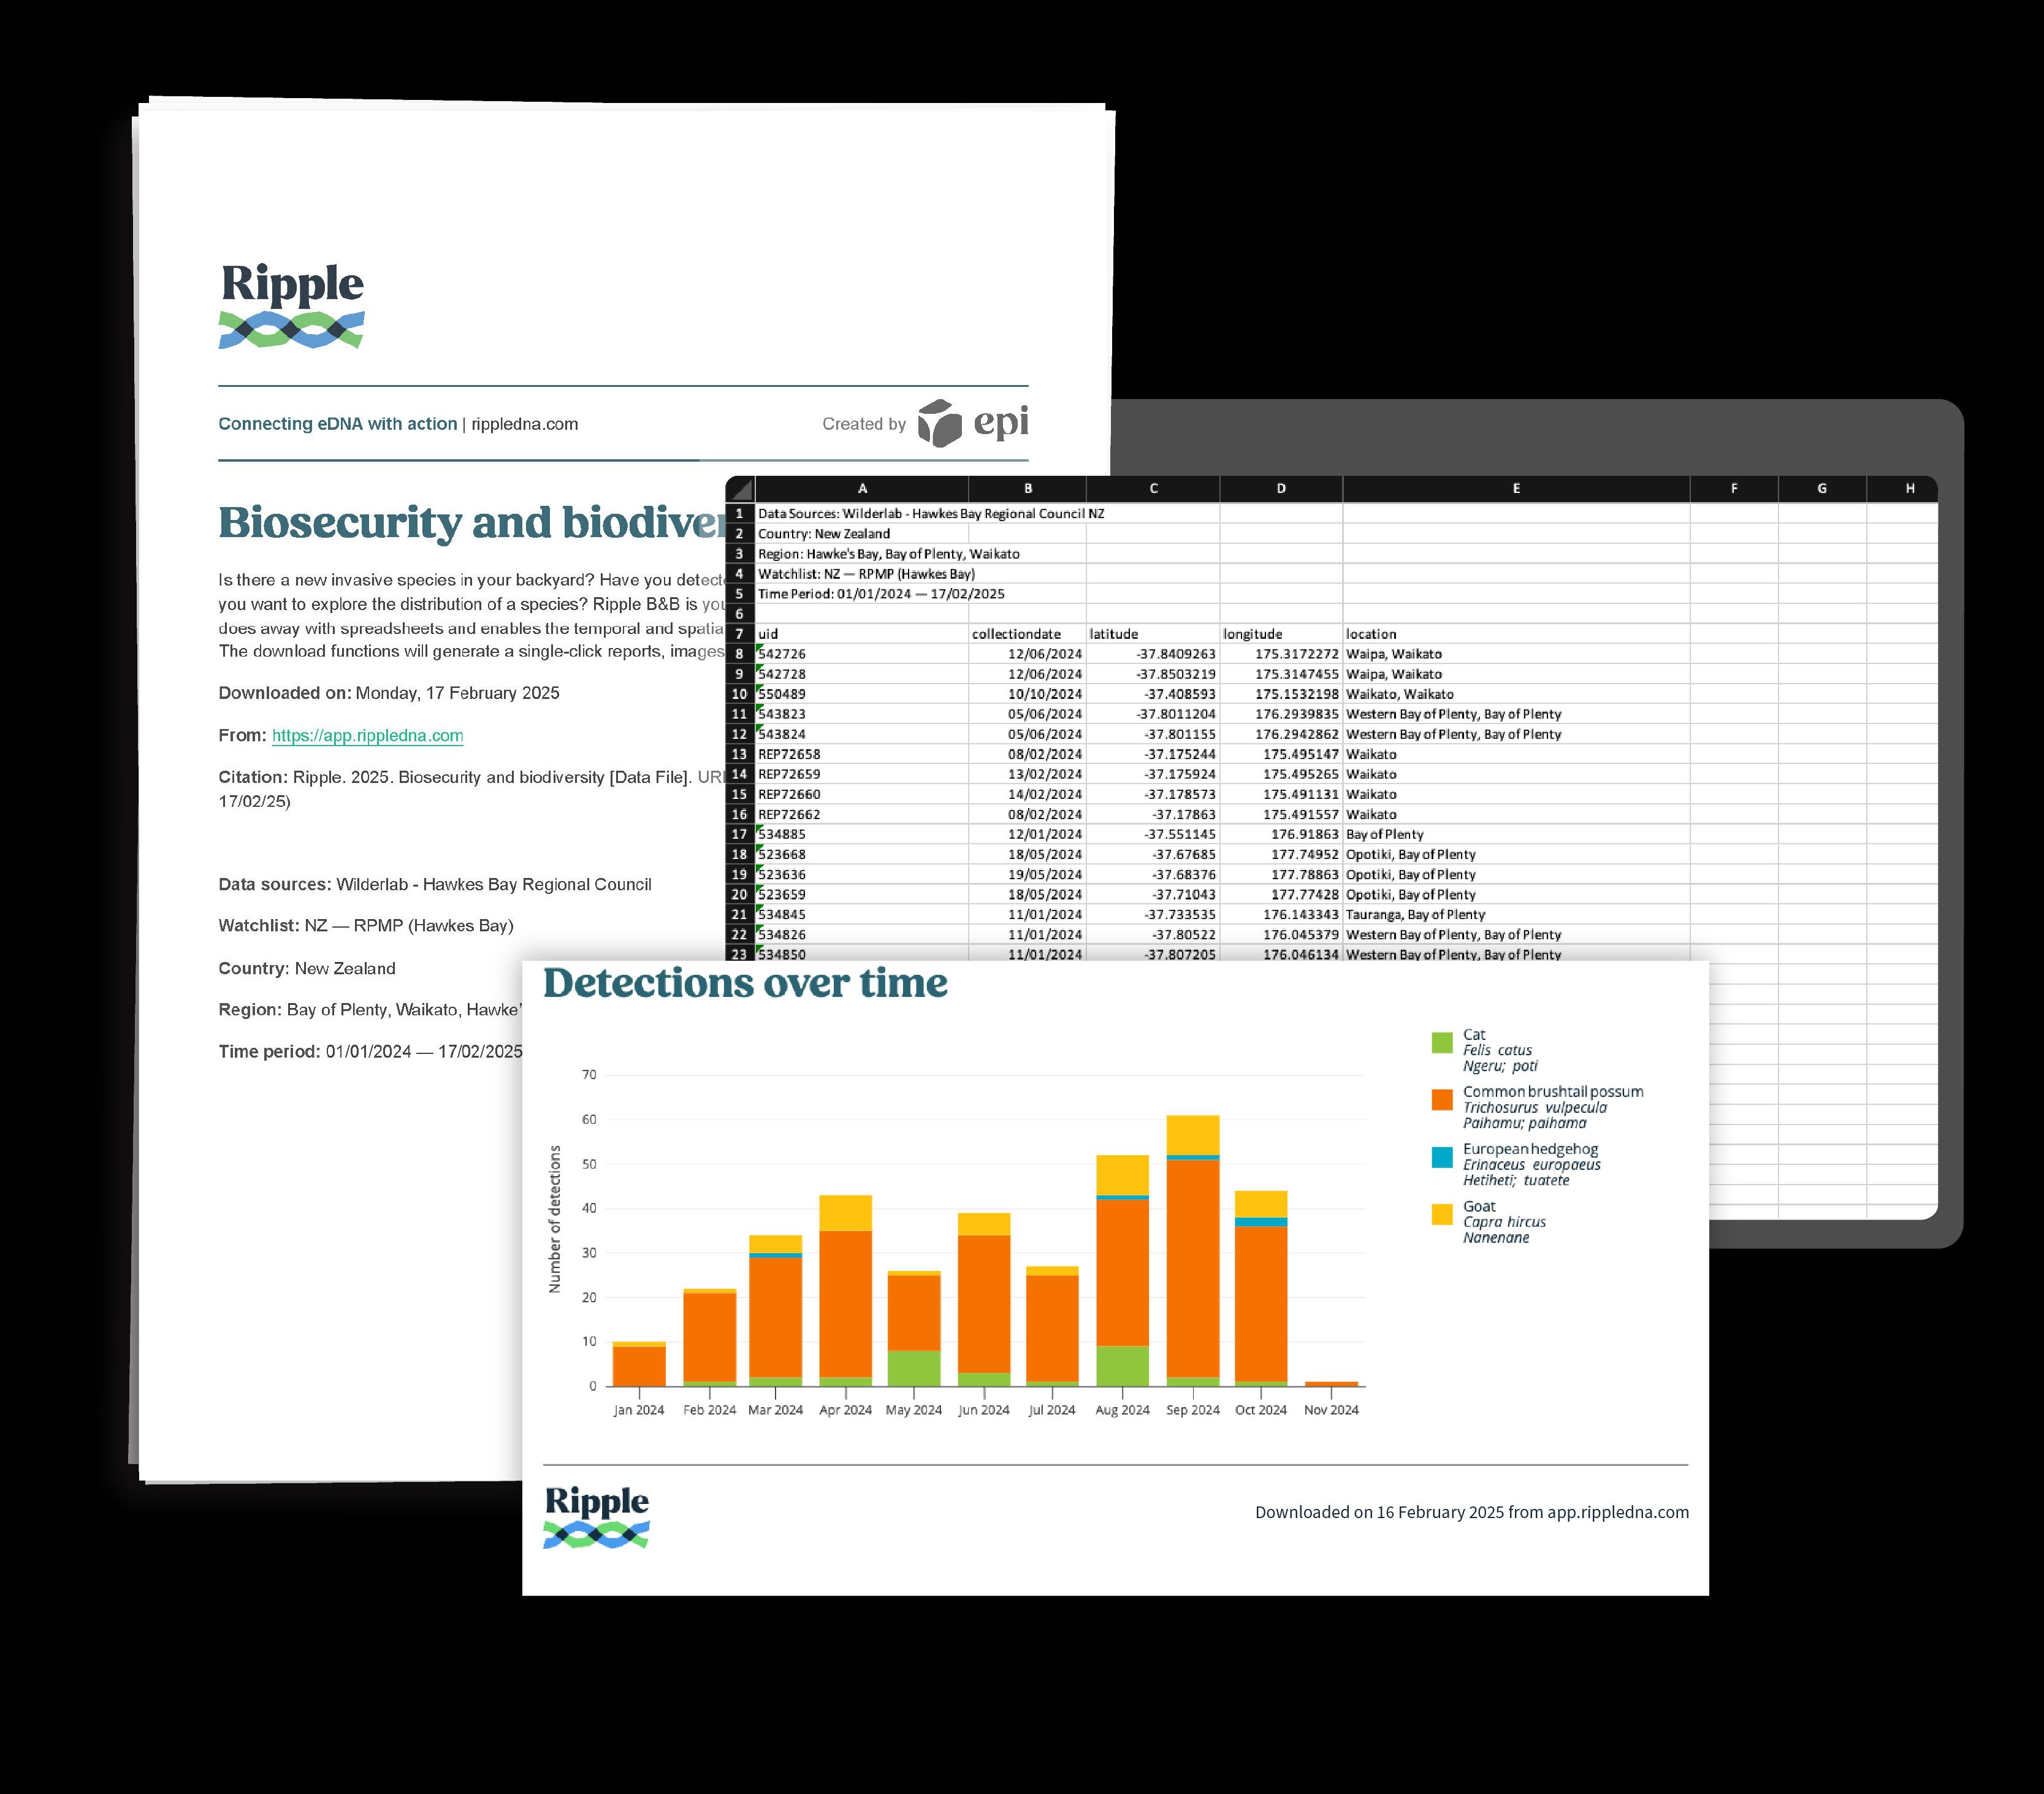
Screenshots of various downloadable data sources in Ripple, such as PDF reports, XLXS data files, and images of graphs.

Automated reports and downloads

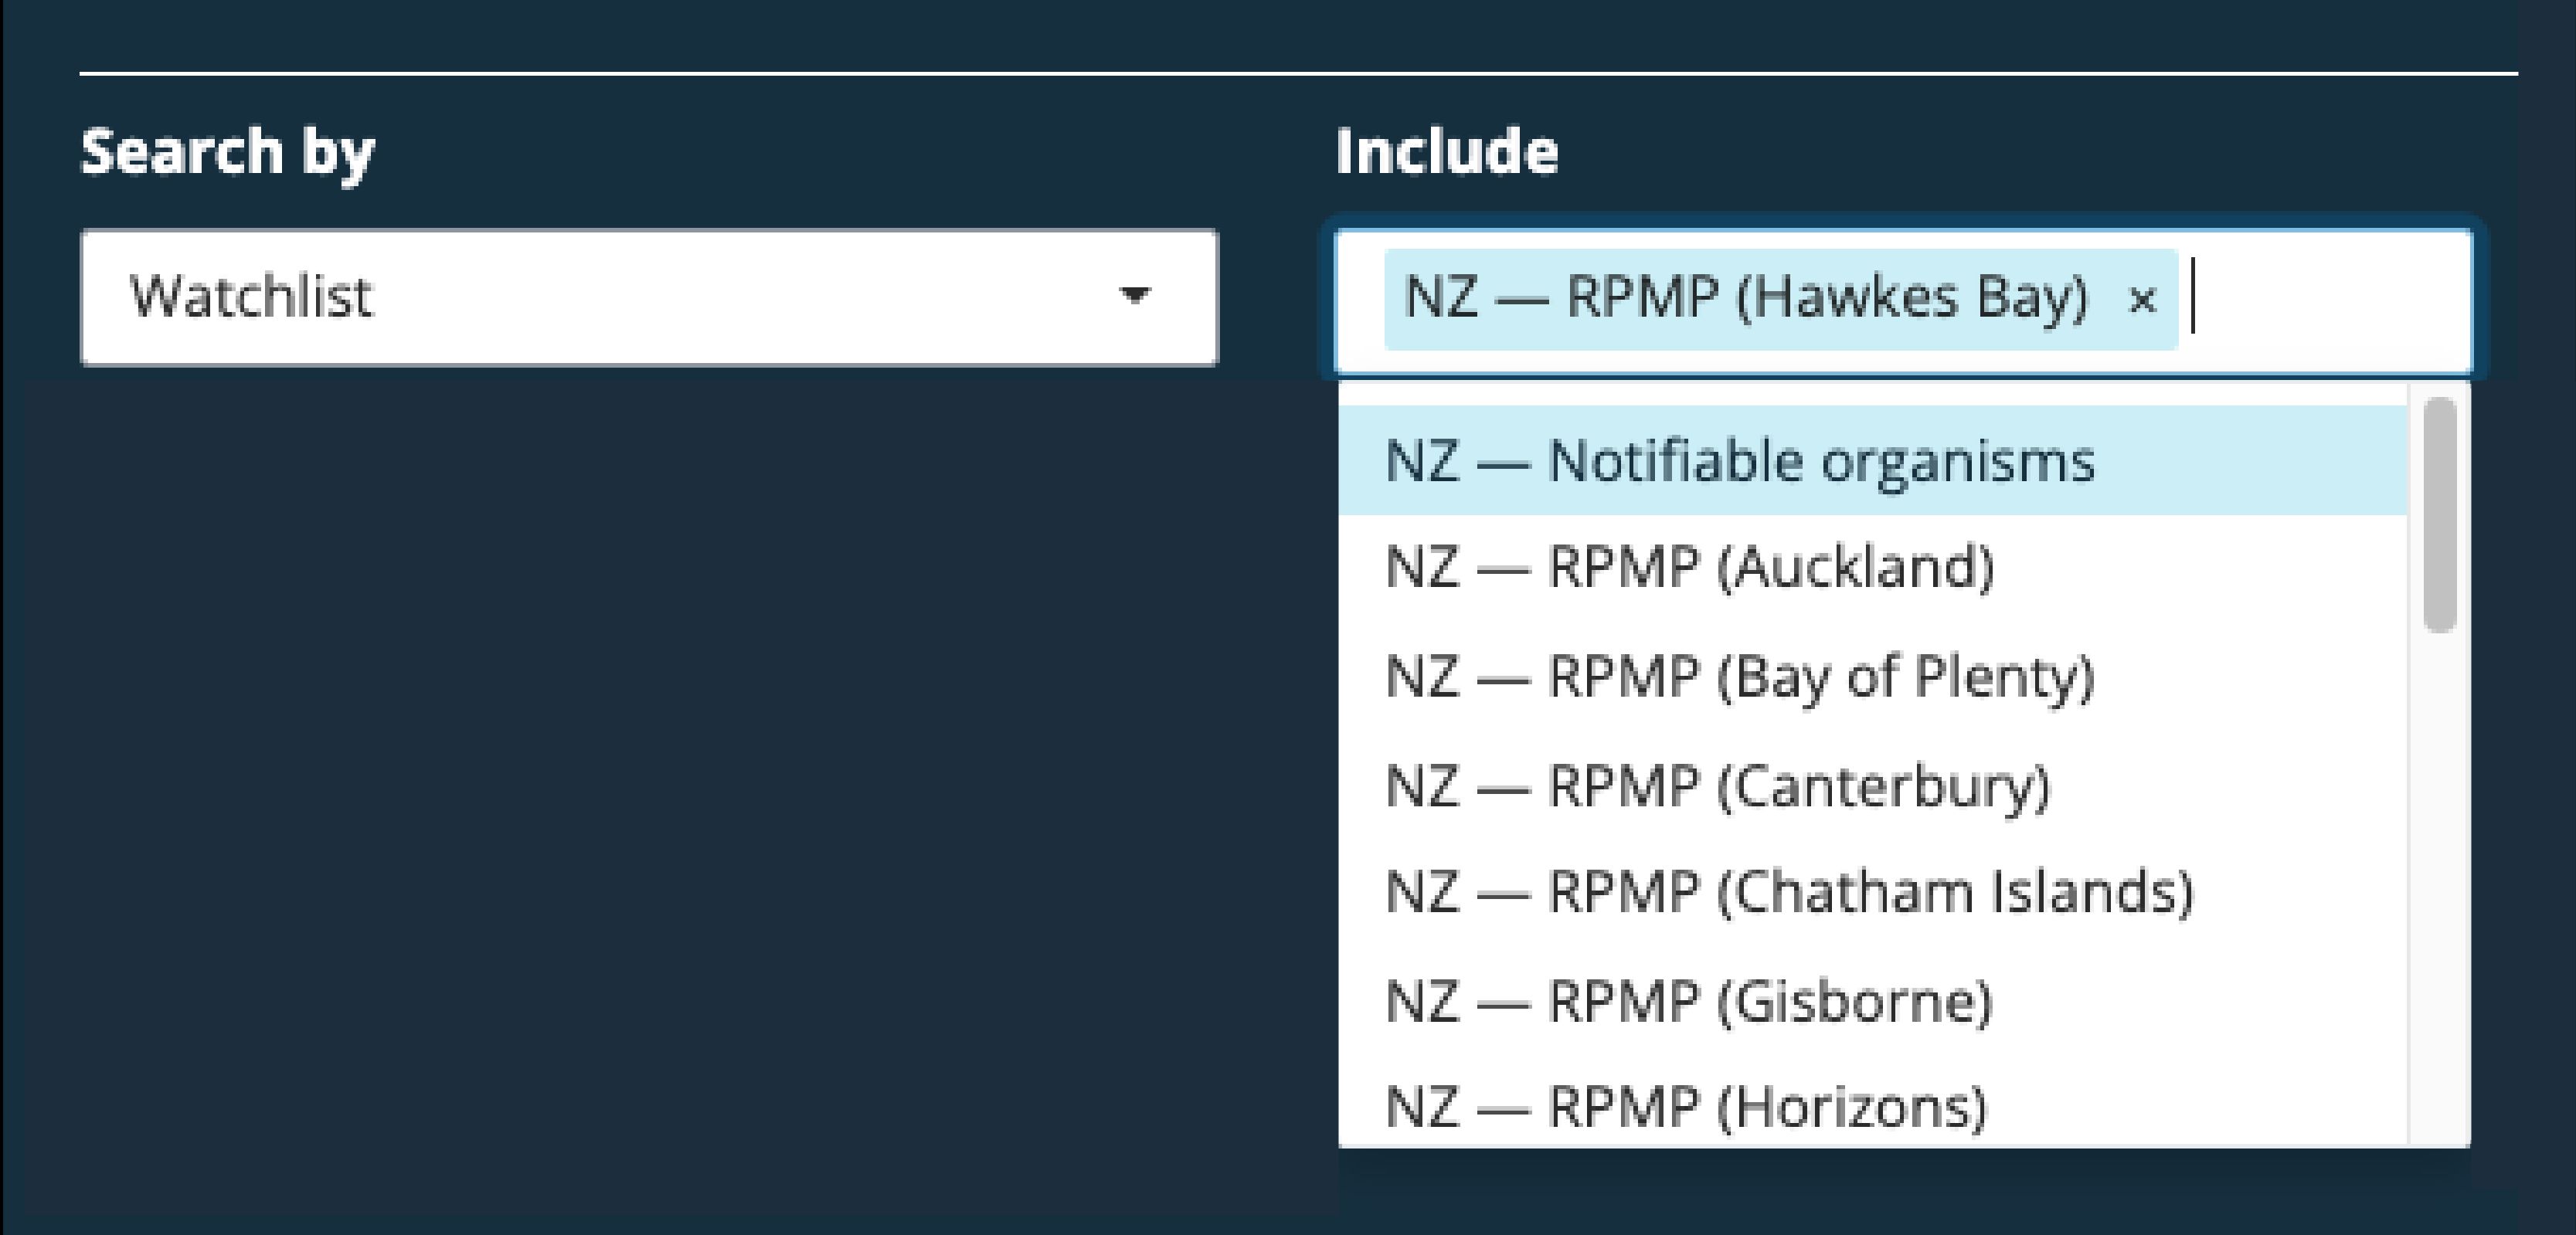
Screenshot of the Ripple app showing the ability to search species by pre-defined invasive species watchlists.

Made to collaborate

Share data sets or watchlists with others and explore eDNA across boundaries.
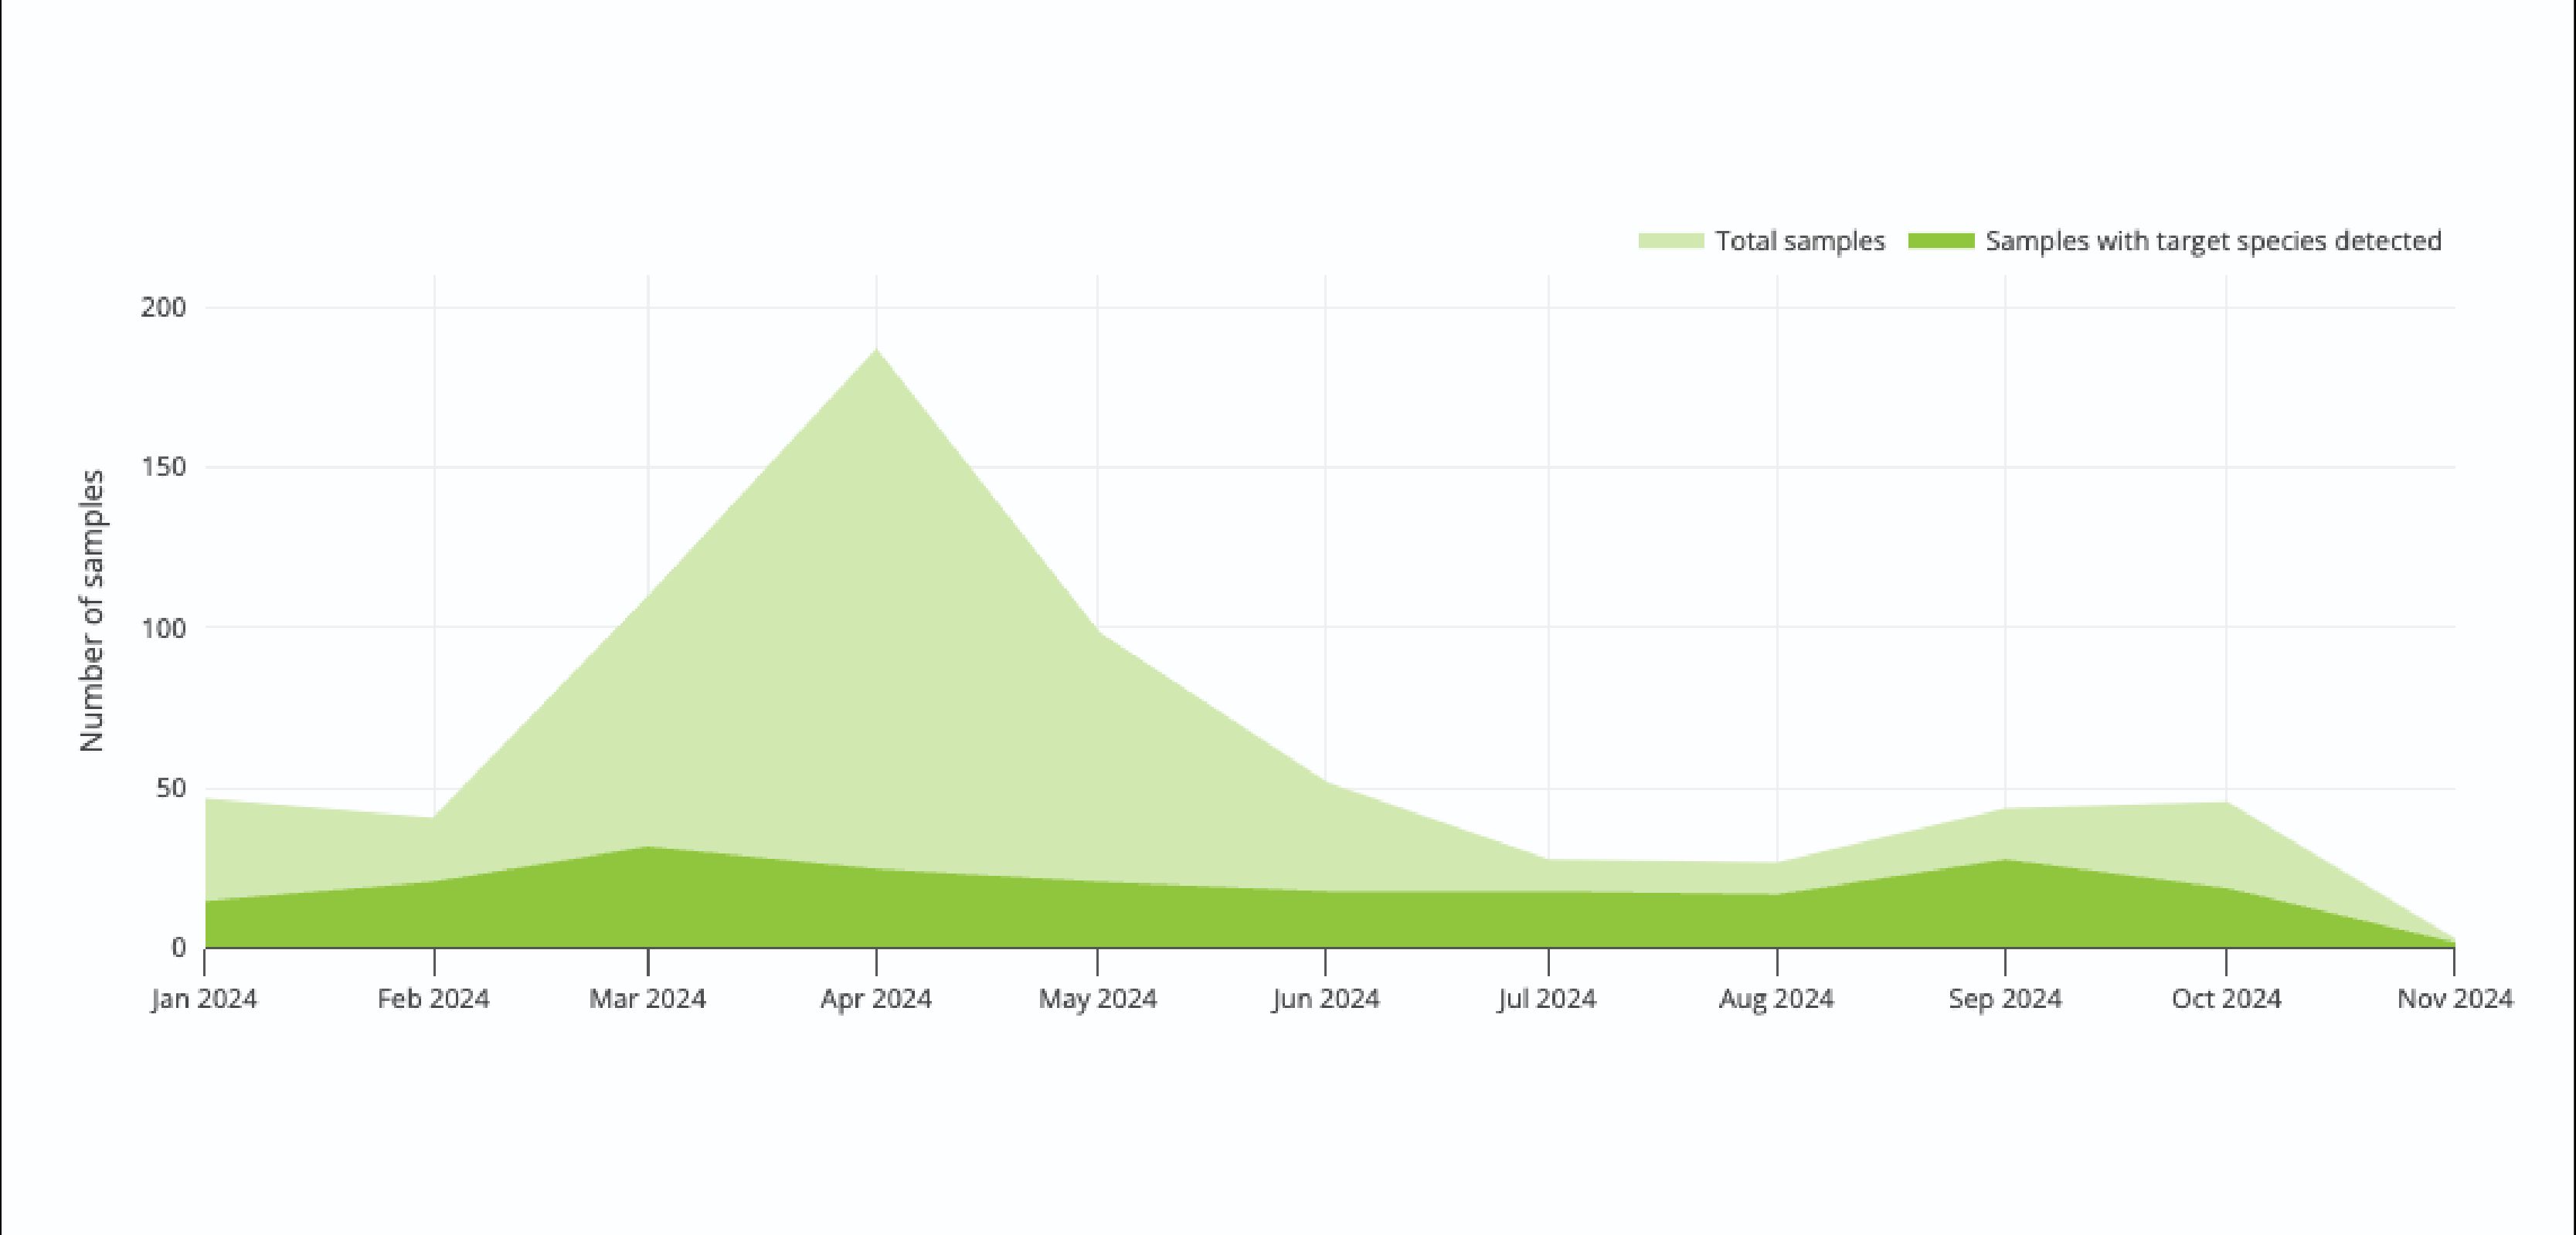
Screenshot of a line-chart in the Ripple app, showing frequency of samples over time

Developed with a sense for practical needs

The significance of eDNA detections can be linked to the frequency and intensity of sampling at any point in time.
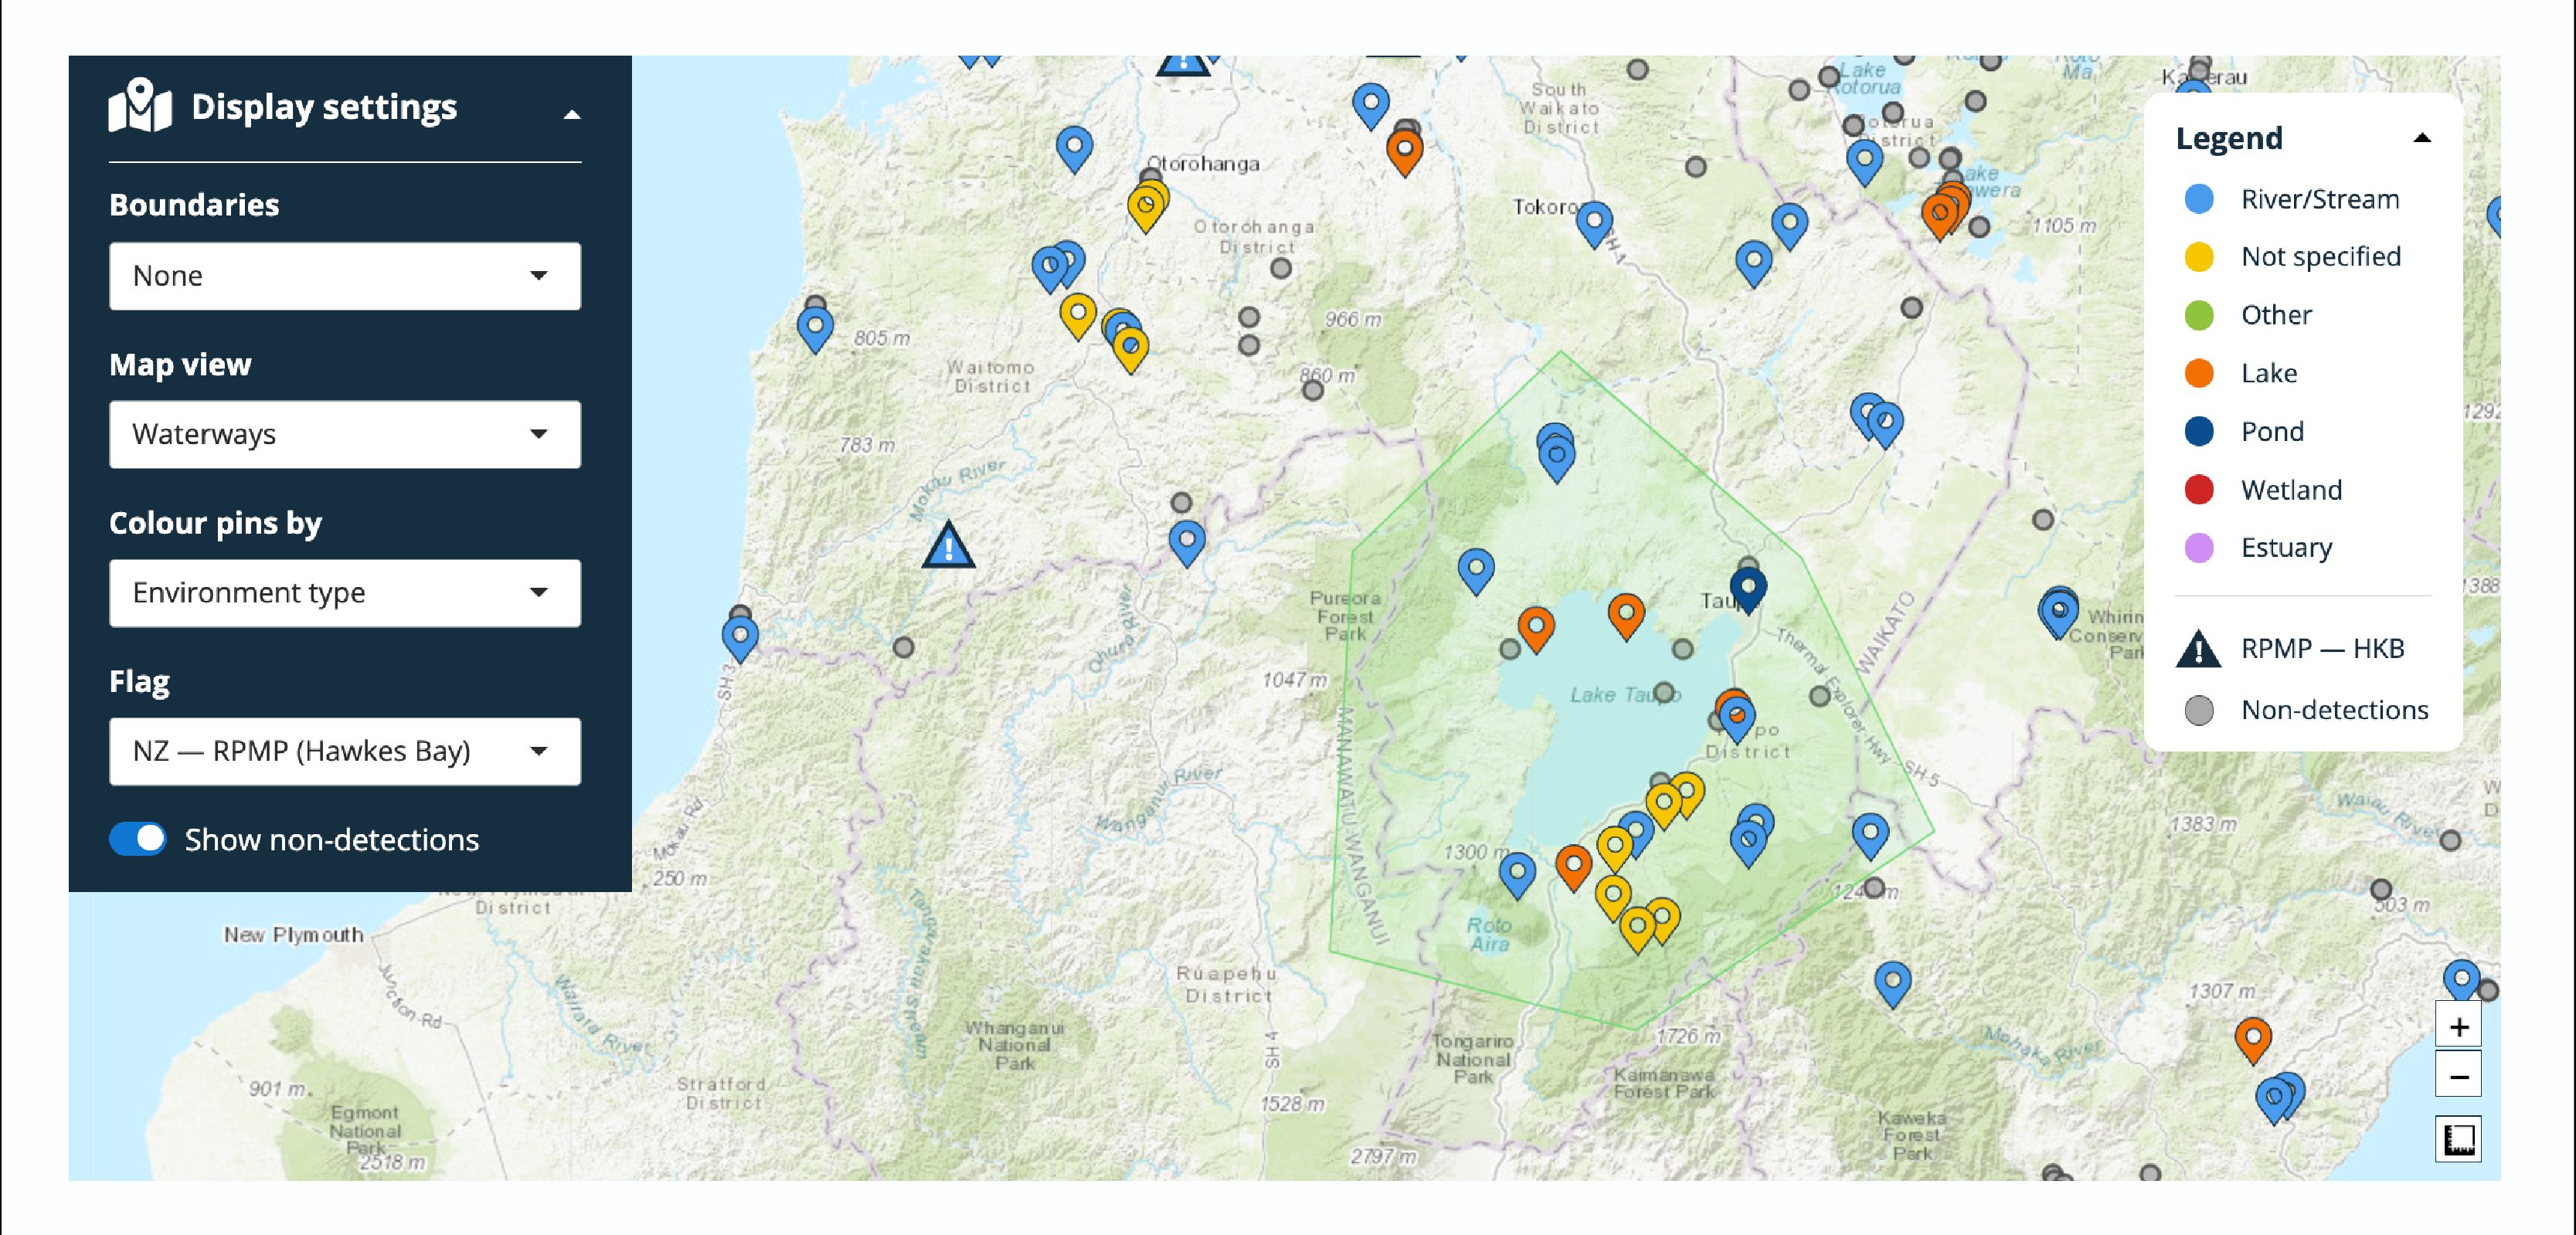
Screenshot of the Ripple sample map, which has a large number of available filters, and multiple colour-coded markers.

Functionality that enables rather than frustrates

Visualise detections in space and time with a plethora of custom features. Full details for a sample of interest can be retrieved easily.

A subscription for everyone

Join today and help us make Ripple the best eDNA platform there is

Limited subscriptions

Early access

  • Unlimited access to Ripple and its growing features
  • Share your data with others
  • Suggest new custom features
  • Dedicated user support

Ready to change how you work with eDNA data?

Book a demo and start your free trial

Keep in touch

Want to keep up with Ripple updates and new features? Sign up to our newsletter to be the first to hear.